


Project X #10 ~ Build an Interactive Data App with Streamlit
We build an Interactive Data App using Streamlit. Our app is able to automatically clean your data, create visualizations on the spot and export your data into different formats.

Hey there nerds, welcome to this month's Project X. This is our 10th project here on Project X, that’s pretty exciting. This is also the first edition for 2025 and honestly this is the most fun I’ve had on a project in a while!
This time, we’re building something super useful with Python—a Data Sweeping Tool using Streamlit and pandas.
My mission for Project X? To empower you with the tools and knowledge to unleash your creativity and build impactful, real-world solutions using Python.
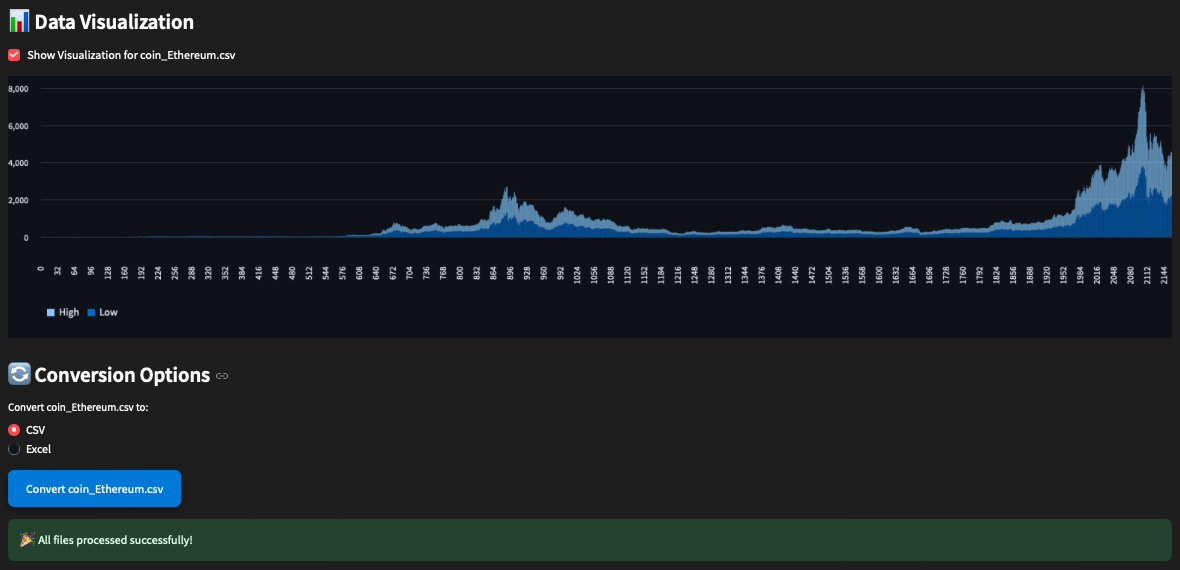
The idea is to make it easy to switch between CSV and Excel files, plus the added ability to automatically clean and visualize your data right in the app.
Picture this: You’ll be able to convert multiple files at once, clean up the data right then and there, and see the results with just a few clicks—all in a smooth and easy-to-use web app.
This project takes you from simple file handling to creating full-on data tools. By the end, you’ll have a working file converter that you can tweak, deploy, and even add more features to it.
Welcome to Project X – where dreams meet code! Dive into creativity as I guide you through the creation of a captivating project, step by step, in each monthly edition. From conceptualization to execution, Project X empowers you to master Python while using your creativity. Join premium today!
If you’re a visual learner like I am then this is an incredible project and for any data analyst out there, this project is sure to speed up your work flow to get you working with your data so much faster!
Since we’ve recently finished up our SQL in Python series, this project is a perfect wrap of things, as It’s a project you could add to a portfolio using all the skills you’ve been learning through the Data Analytics and SQL in Python series.
And on top of all this you get to work with the incredibly useful Streamlit framework to get us building we apps faster with Python. At the end of the article I made a video for you guys that takes you through our project step-by step as a bonus!
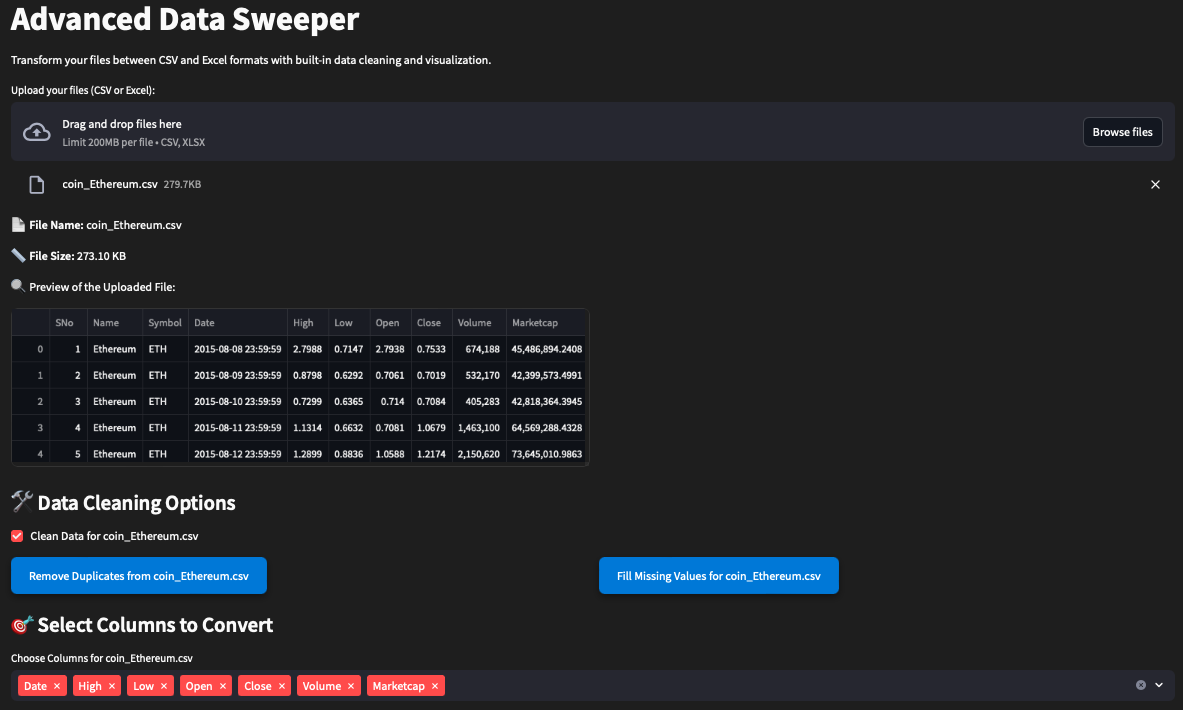
Had to post the pictures in two because we have all this functionality. This is the project you will be building out today as you get to use the skills we covered over the course of 2024 with our Data Analytics and SQL in Python series’.
I’ll link the previous Project X here where we blended PostgreSQL with Python for Better Scalability for future reference.
👉Premium readers can recommend projects at the bottom.
👉 Access my Source Code for all Projects at the bottom.
👉 Access interactive step-by-step video as the bottom.
These projects take a lot of time and resources for me to craft in a way that I can present them and share them for you all. If you find value in my work please consider becoming a premium reader!
This is my full-time job so I hope you will support my work!
👉 If you value projects like this one, please leave it a ❤️ and share it with others. This helps more people discover these projects, which helps me out!
Let’s break it all down, step by step. Are you ready to have your mind blown?
Keep reading with a 7-day free trial
Subscribe to The Nerd Nook to keep reading this post and get 7 days of free access to the full post archives.